Monitor inference
The inference monitoring page provides an overview of all inferences across your platform, unlike the inference center that displays all inferences within a specific project. On the inference monitoring page, you can track and analyze key metrics and the status of your inferences.
Note
Inference monitoring is limited to those inferences that were started at least once.
The inference monitoring page includes the following sections:
-
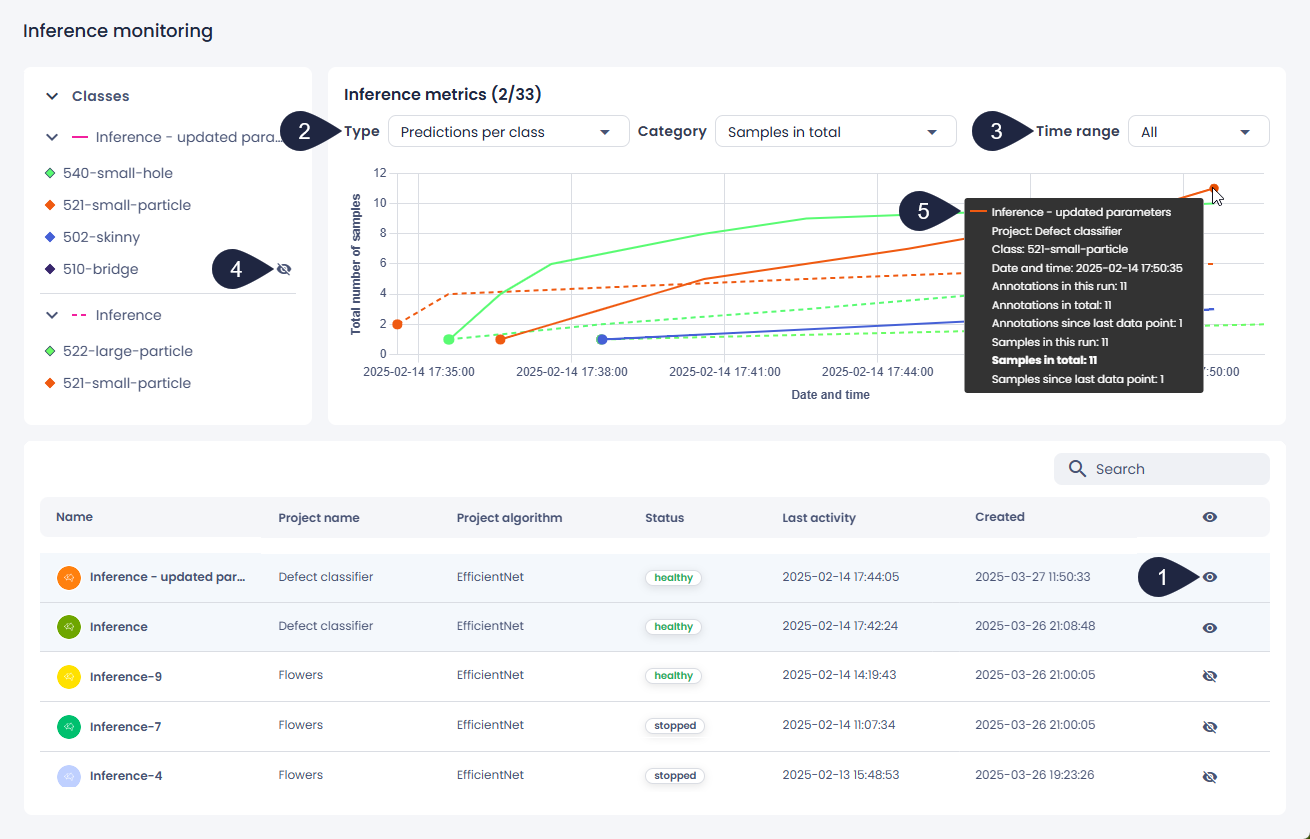
Inference metrics
Displays a line chart with data points representing the inferences currently visible.
Glossary
Data points are individual measurements plotted on the line chart, each representing a specific moment in time with its associated metrics.
By default, the chart shows the five most recently active inferences. If any of these inferences receive new data, the chart updates automatically every minute.
-
Inferences table
Lists all inferences in descending order of their last activity. Rows with visible inferences are highlighted with a light-blue background. The table also provides the following details:
- Inference name (click it to go to the inference details page).
- Project name (click it to go to the project details page).
- Algorithm used to create the project where the inference was created.
-
Inference status:
- In queue – The inference request has been submitted and is waiting to be scheduled.
- Preparing – The deployment is being created and the algorithm is starting up.
- Healthy – The inference is fully loaded and ready to receive requests.
- Failed – The deployment could not start up and is trying to recover.
- Stopping – The inference is in the process of shutting down.
-
Date and time when the inference was last active.
- Date and time when the inference was created.
Types of metrics
You can monitor your inferences using the following metrics:
-
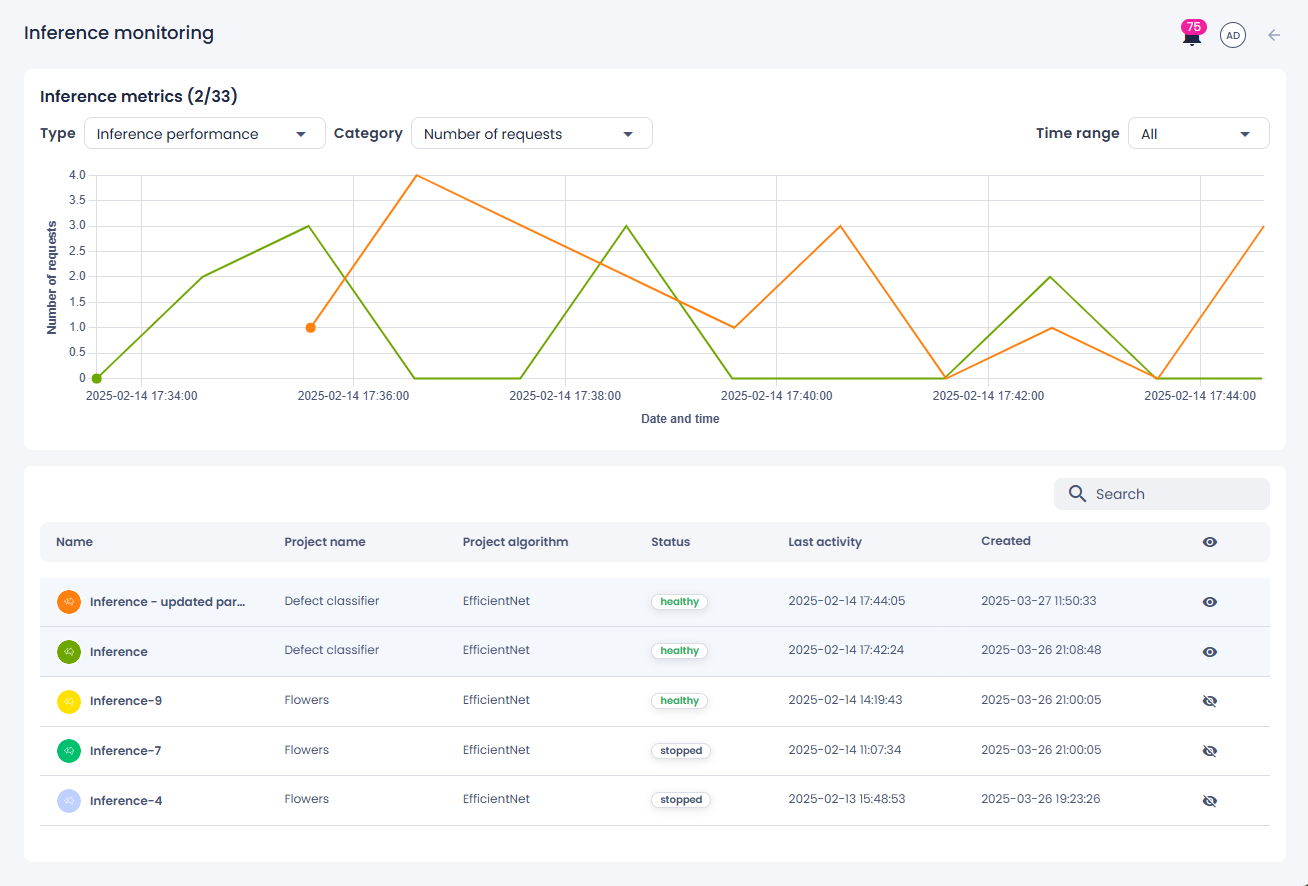
Inference performance:
- Interval period – The time gap (in seconds) between the previous and current data points.
- Throughput – The number of video frames the model processed per second.
- Total number of requests – The cumulative number of predictions made by the model. On the chart, the line rises as predictions are made and remains flat if no additional predictions occur.
- Number of requests – The number of predictions made since the previous data point.
- Number of failures – The number of failures since the previous data point.
- Minimum request latency – The shortest time the model took to generate a prediction since the previous data point. If no requests were made, the value on the chart remains 0.
- Maximum request latency – The longest time the model took to generate a prediction since the previous data point. If no requests were made, the value on the chart remains 0.
- Average request latency – The average time the model took to generate a prediction since the previous data point.
- Average batch size – The average number of processed samples per request over the last 60 seconds. This helps you understand how efficiently your inference is batching images and can guide adjustments to improve GPU/CPU utilization. If no requests were made during the interval, the value is 0. Failed requests (where no images were successfully processed) are not included in the calculation.
-
Predictions per class:
- Annotations in this run – The number of annotations per class since the inference started. If the inference is stopped and restarted, the count starts over from zero.
- Annotations in total – The total number of annotations for each class.
- Annotations since last data point – The number of annotations per class since the previous data point.
- Samples in this run – The number of samples per class since the inference started. If the inference is stopped and restarted, the count starts over from zero.
- Samples in total – The total number of samples for each class.
- Samples since last data point – The number of samples per class since the previous data point.
Unknown rate monitoring
Supported project types: image classification with wafer processing tools (AI-ADC EfficientNet).
You can track how the unknown rate changes over time. If the rate diverges from the initial target unknown rate, your training data may no longer represent the inference data, indicating the need for model retraining.
To view metrics for your inferences
-
On the menu, go to Inference monitoring.
-
In the table, select which inferences you want to view on the chart:
- To hide or display all inferences, click the eye button in the table header row.
- To hide or display individual inferences, click the eye button next to the necessary inference.
In the table, the rows with visible inferences are highlighted with a light-blue background.
Tip
To display all healthy inferences:
- In the search box above the table, enter healthy.
- Click the eye button in the table header row.
-
Above the table, in the upper-left corner of the chart, select the metrics type you want to view, and then select the metrics category.
The chart doesn't appear if:
- The inference hasn't generated any data points yet. The chart will display once data becomes available.
- The selected metric is not supported by the algorithm that was used to create the project's inference.
-
In the upper-right corner of the chart, select the time range for the data displayed on the chart.
- Predictions per class metrics: To hide or display a class on the chart, click the eye button next to the class name.
- To view more details about a specific data point on the chart, hover over it.