View class distribution
The class distribution chart shows the number of samples per class by one of the sources—user or the Prediction tool. This allows detecting the unbalanced class distributions that may cause problems in classification models. The class distribution chart for other sources is available in the train and test centers.
Tip
Change the platform layout to the split-view mode when working with charts and data filtering.
To view the class distribution chart in the label center
-
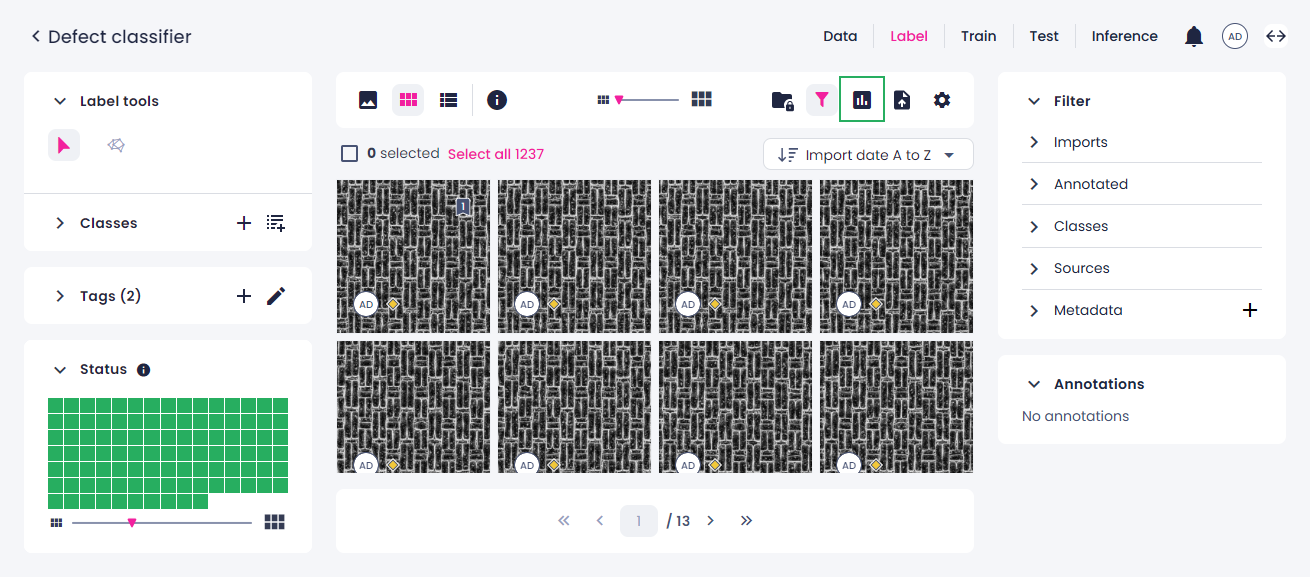
In the label center, on the top toolbar, click the charts button.
-
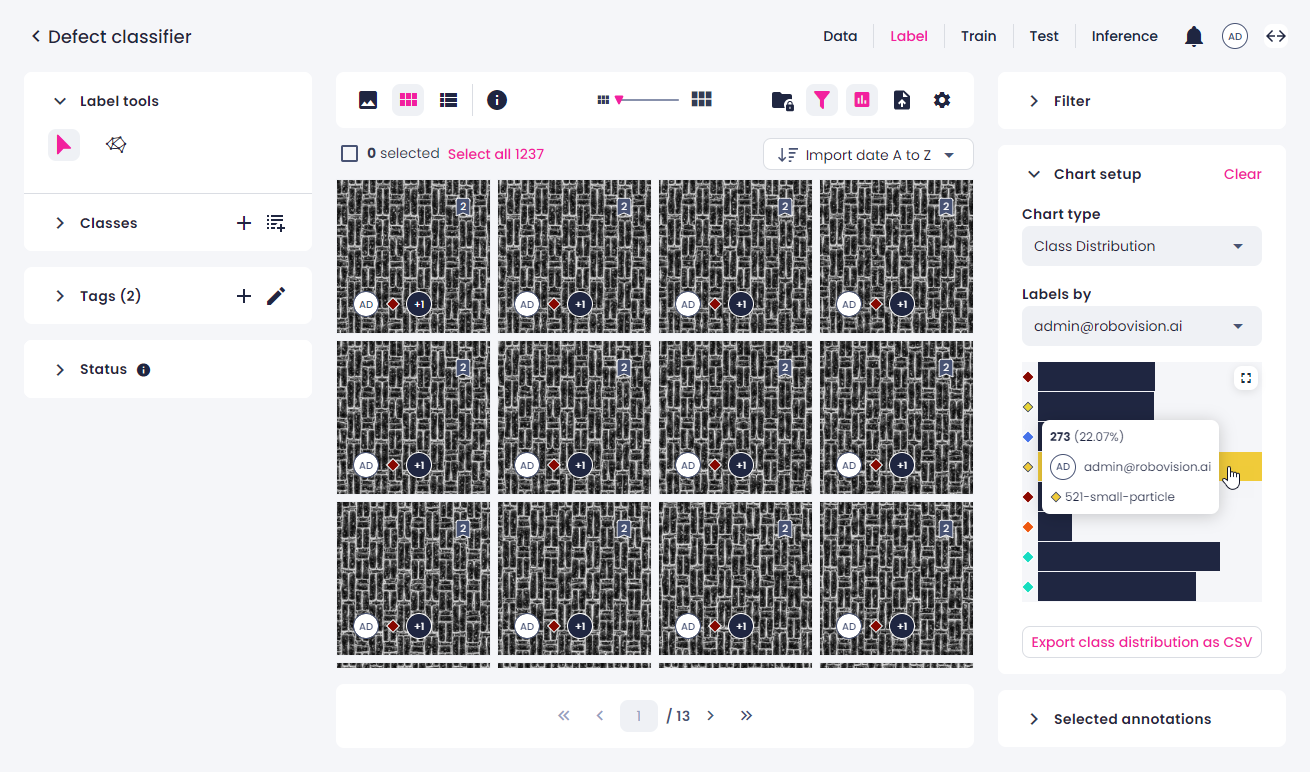
On the right, in the Chart type field, select Class distribution.
- In Labels by, select the source whose labels will be displayed in the chart.
-
Once you have built the class distribution chart, you can do the following:
-
To view the number and percentage of samples labeled with a certain class, hover over the respective bar.
-
To filter the samples by class, click the bar next to the necessary class. To display all the samples, click the same bar again.
- To export the chart as a CSV table, click Export class distribution as CSV.
-
-
To maximize the chart to full screen, in the upper-right corner of the chart, click
 .
. - To minimize the chart, in the upper-right corner, click
 .
. - To clear the chart setup, in the upper-right corner, click Clear.
When using the chart, note the following:
- If you update annotations while the chart is open, you will be prompted to refresh the chart.
- If you apply a filter when the chart is already open, the filter isn't considered. To refresh the chart, click Clear in the upper-right corner of the Chart setup panel, and then set up the chart again.