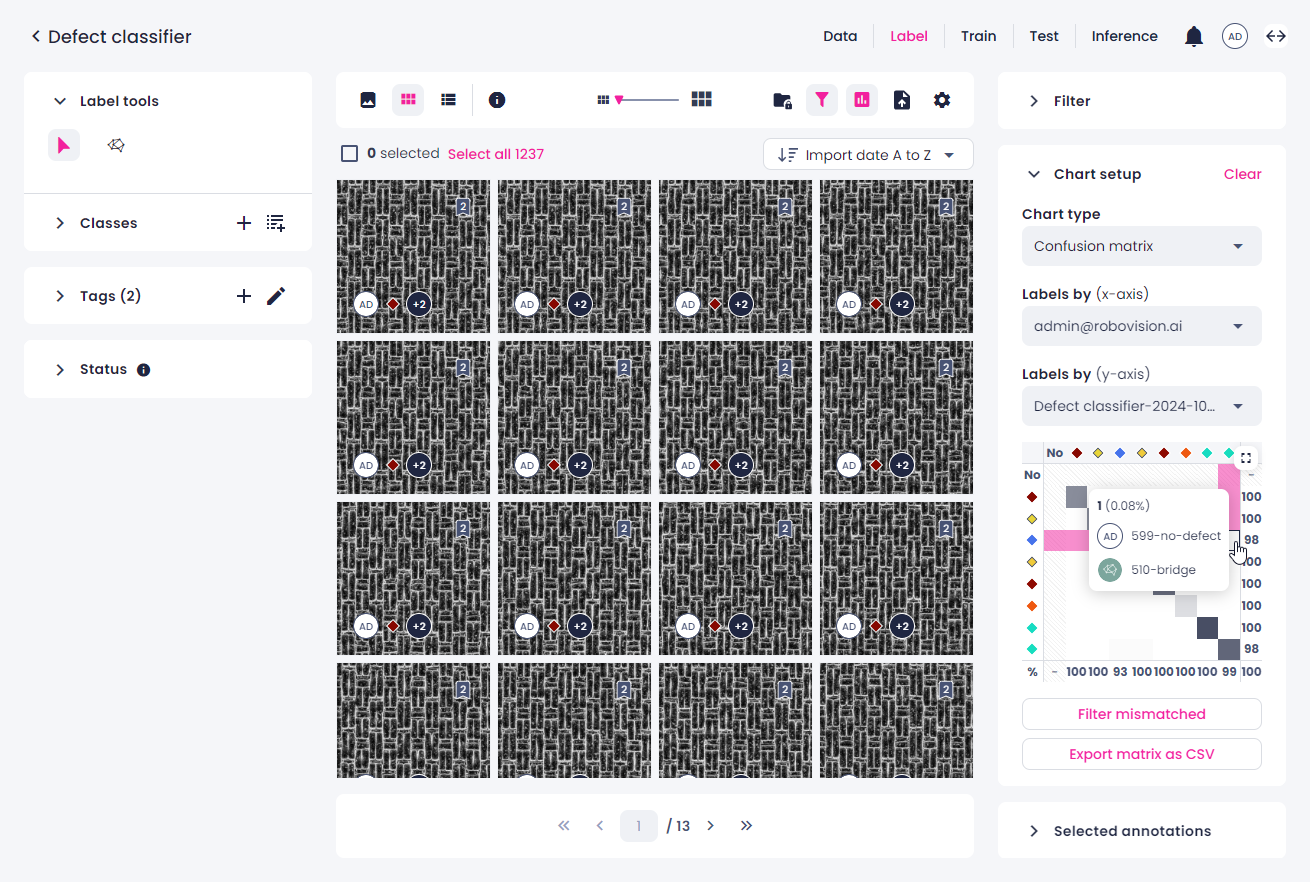
View confusion matrix
![]() Supported for: EfficientNet and AI-ADC EfficientNet
Supported for: EfficientNet and AI-ADC EfficientNet
In the label center, users can use the confusion matrix to compare the labels of two sources—labelers or predictions by the Prediction tool.
In the confusion matrix, the diagonal elements show the number of annotations which coincide for two sources, while off-diagonal elements are those that differ, and as a result might indicate that the samples are mislabeled. Therefore, the higher the diagonal values of the confusion matrix, the better—indicating many correct labels.
Tip
Change the platform layout to the split-view mode when working with charts and data filtering.
To view the confusion matrix in the label center
-
In the label center, on the top toolbar, click the charts button.
-
On the right, in the Chart type field, select Confusion matrix.
-
Select the sources whose labels will be displayed as an X and Y axes of the matrix.
You can compare:
- Your labels with the labels from another source (another user or the Prediction tool).
- The labels from two other sources.
-
Once you have built the confusion matrix, you can do the following:
-
View the number and percentage of samples of a certain category by hovering over the respective cell.
-
Filter the samples categorized by the confusion matrix.
- To view the samples per one category, click the necessary table cell. To display all the samples, click the same cell again.
- To select multiple cells of the matrix, hold the Ctrl/Cmd key, and then select the necessary cells. This shortcut is only available when the matrix is minimized.
- To view all mismatched (off-diagonal) samples, click the Filter mismatched button below the matrix. To clear the selection, click Deselect mismatched.
-
Export the confusion matrix.
- To export the chart as a CSV table, click Export matrix as CSV.
-
-
To maximize the chart to full screen, in the upper-right corner of the chart, click
 .
. - To minimize the chart, in the upper-right corner, click
 .
. - To clear the chart setup, in the upper-right corner, click Clear.
When using the chart, note the following:
- If you update annotations while the chart is open, you will be prompted to refresh the chart.
- If you apply a filter when the chart is already open, the filter isn't considered. To refresh the chart, click Clear in the upper-right corner of the Chart setup panel, and then set up the chart again.