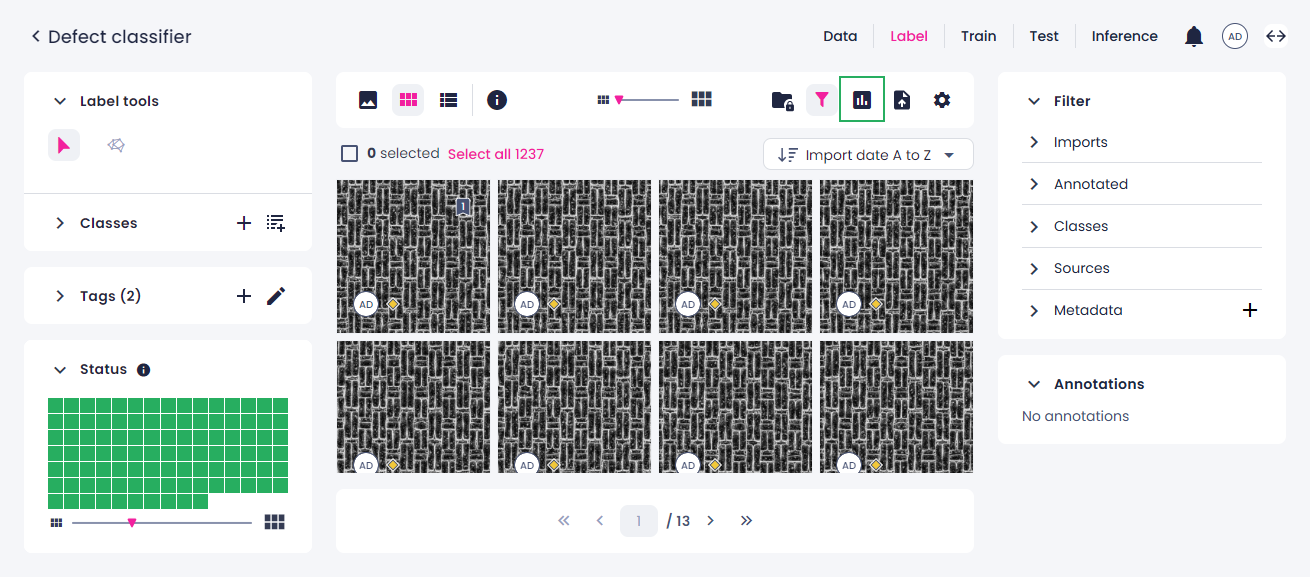
View wafer map
![]() Supported for: AI-ADC EfficientNet
Supported for: AI-ADC EfficientNet
A wafer map in Robovision AI is a chart in the label center. The chart is intended for the semiconductor industry and features samples on the wafer and a grid that outlines the dies. Each sample is represented with a dot:
-
Labeled samples have the same color as the annotation class.
If a sample has annotations from several labelers, the most recent annotation is displayed.
-
Unlabeled samples are marked with gray.
You can use the wafer map to do the following:
- View all samples on the wafer at the same time.
- Get an overall idea about the location of the problem.
- Closely examine individual regions of the wafer for defects and anomalies.
Tip
- Change the platform layout to the split-view mode when working with charts and data filtering.
- The wafer map chart has been optimized for the browser size of 1920x1080 in the full-screen mode. To enter the full-screen mode, press F11.
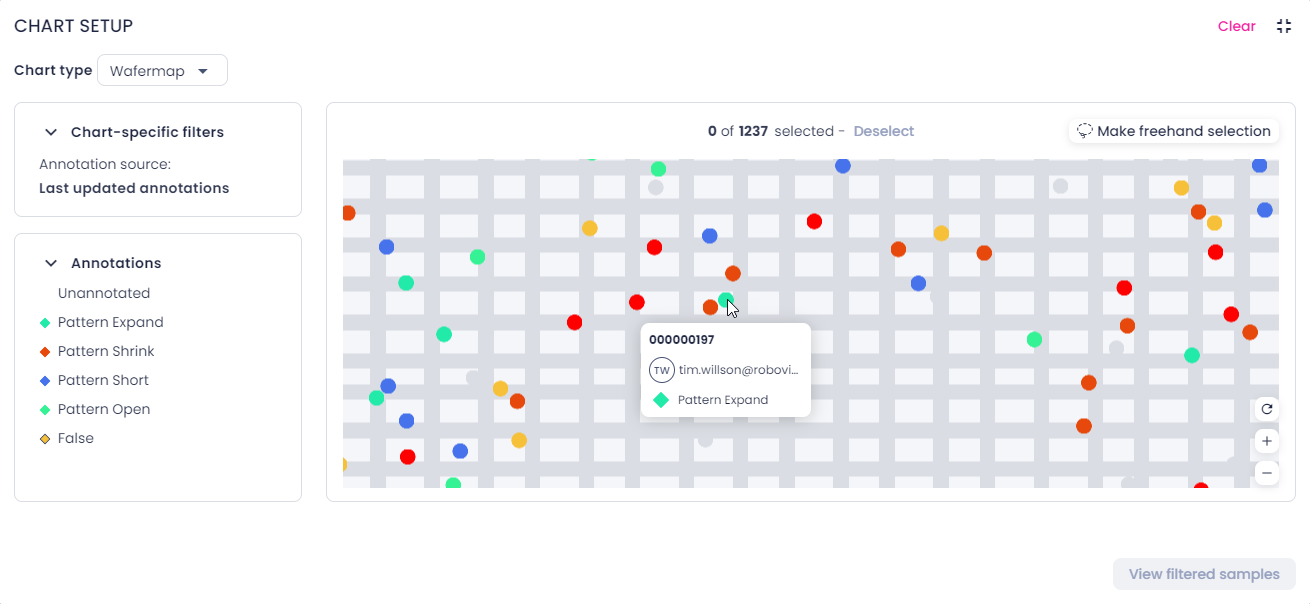
To view the wafer map
-
In the label center, on the top toolbar, click the charts button.
-
In the right panel, in the Chart type field, select Wafer map.
- To maximize the chart to full screen, in the upper-right corner of the chart, click
 .
. -
To navigate the chart, do the following:
- To zoom in or out, move the wheel button or use the buttons in the lower-right corner of the chart.
- To pan the chart, click and drag.
- To reset the zoom level, in the lower-right corner of the chart, click
 .
.
-
To get more information about a sample, hover over the needed dot.
You can view the sample name, annotation source, and class name.
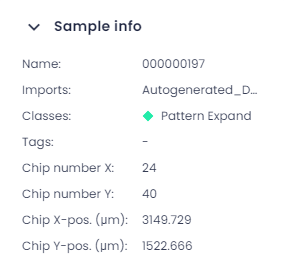
Note
To find the exact coordinates of the sample, in the single view, on the top toolbar, click the info button (
 ).
).
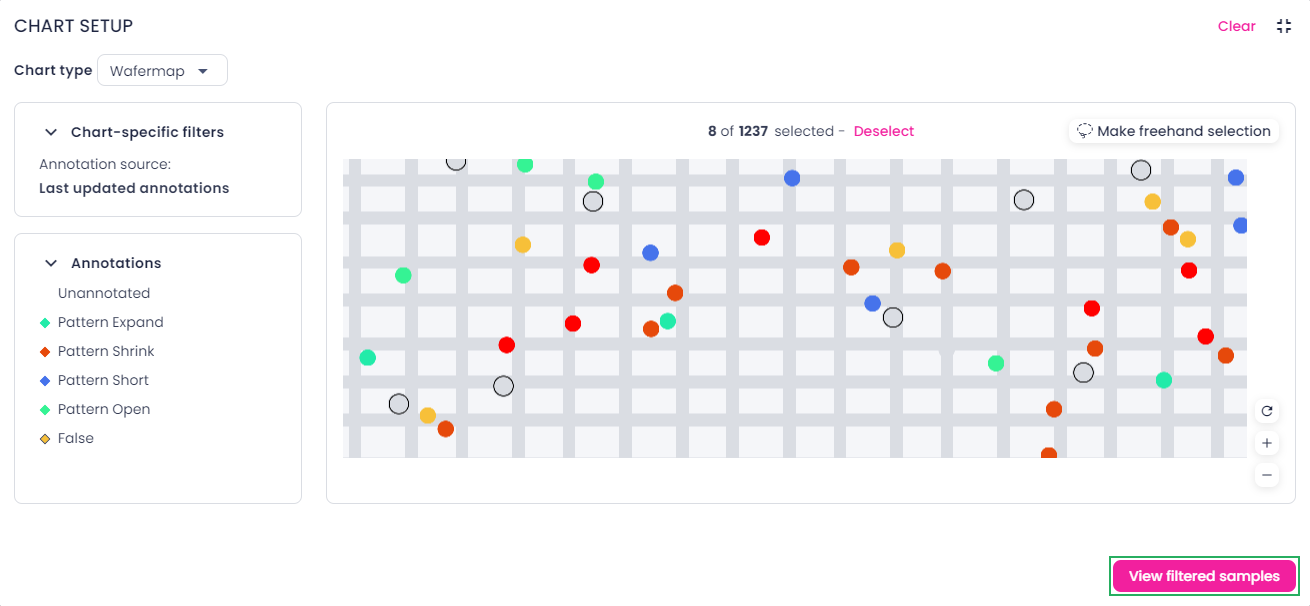
-
To view specific samples in the label center, do one of the following:
-
By using the Ctrl key:
-
Press and hold the Ctrl key, and then click the dots that you want to view in the label center.
Selected samples have a black outline.
-
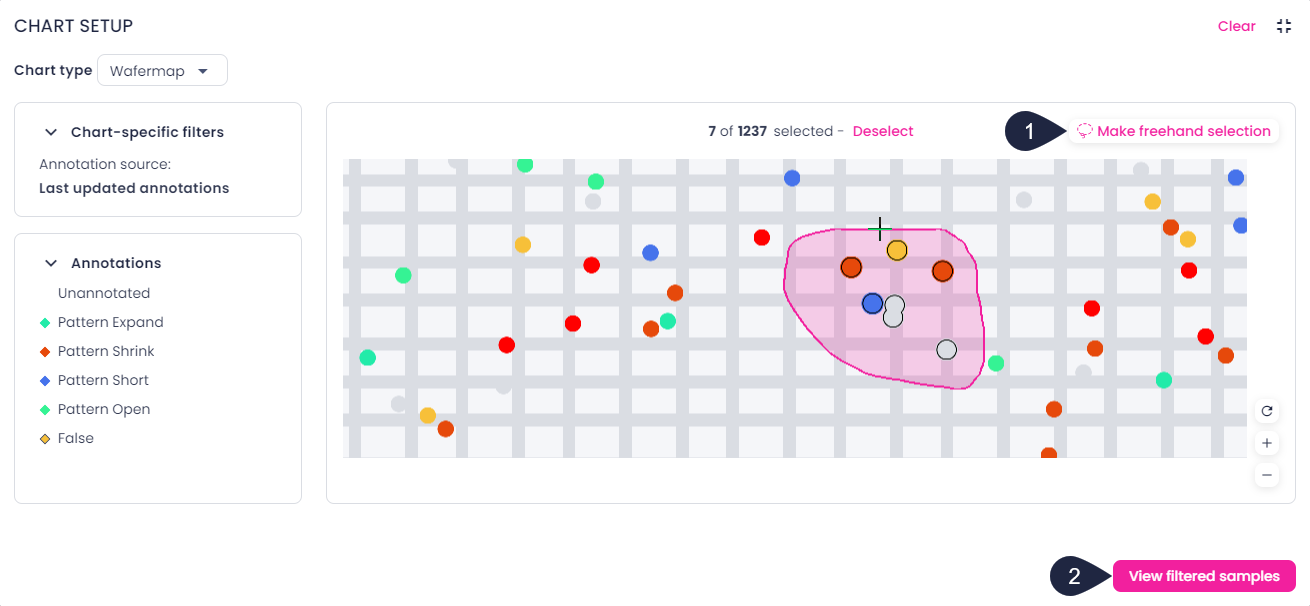
To view selected samples in the label center, in the lower-right corner of the chart, click View filtered samples.
-
-
By making a freehand selection:
-
In the upper-right corner of the chart, click Make freehand selection (1).
Alternatively, you can press and hold the Shift key.
-
Press and hold the mouse button and move the pointer around the samples that you want to view in the label center.
The number of selected samples is displayed above the wafer map.
-
To add more samples to the current selection:
- Click Make freehand selection.
- Press and hold the Ctrl key.
- Press and hold the mouse button and move the pointer around the samples that you want to add to the current selection.
-
To view selected samples in the label center, in the lower-right corner of the chart, click View filtered samples (2).
-
-
-
To clear the selection in the chart, click Deselect above the wafer map or double-click anywhere outside the selection.
- To minimize the chart, in the upper-right corner, click
 .
. - To clear the chart setup, in the upper-right corner, click Clear.
When using the chart, note the following:
- If you update annotations while the chart is open, the wafer map will automatically reload.
- The chart takes into account the filters you have applied. When the filters change, the wafer map reloads automatically.
- If your project has multiple KRF imports, the wafer map shows the grid from the most recent import. If the latest KRF lacks a grid, none will be displayed, even if the previous import has one.