Polygon tool
The Polygon tool allows drawing straight-edged segments of a selection border. You can create as many segments as you need to draw a selection border.
To label with the Polygon tool
- In the Projects module, click the necessary project.
-
In the Label center section, select the needed import or click the right-arrow button (
 ).
).
The data opens in the label center.
-
On the top toolbar, switch to the single view.
-
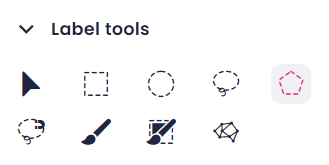
In the left panel, in the Label tools section, select the Polygon tool.
Note
If you don't see the needed tool, create at least one class.
-
In the Classes section, select the necessary class.
-
In the image, click where you want the first straight segment to begin, and then click where you want this segment to end and the next one to begin. Continue clicking to create segments.

-
To close the selection, click the starting point.
-
To edit an existing polygon, select the necessary item using the Select tool, and then do one of the following:
- To add to an existing annotation, select the necessary tool, click Add to item, and then make a new selection to intersect with the existing selection.
- To subtract from an existing item, select the necessary tool, click Cut from item, and then make a new selection to intersect with the existing selection.
- To edit an existing item, drag the anchor point you want to move. The anchor points become visible when the polygon is selected, and the polygon updates in real time while you drag. You can move anchor points only before you submit the annotation.
-
To change the class of a selected label, in the Classes list, select the necessary class.
Your annotations are displayed in the Annotations panel on the right. Note that members with the Labeler role can view only their own annotations or annotations generated by the Prediction tool.
-
In the lower-right corner, click Submit.
To navigate between samples, use one of the following:
- In the single view, use the arrow buttons on the bottom toolbar to navigate between samples or specify the number of the sample you want to open.
-
In the thumbnails and list views, you can view a maximum of 100 samples per page:
- Use the Status panel on the left to navigate between the 100 samples on the page. You can also get the overview of the labeled and unlabeled samples within the page. The labeled samples are marked with green or blue, while unlabeled – with gray. Green indicates that the sample is annotated by the logged-in user, while blue indicates that the annotation comes from another user or is generated by the Prediction tool.
- Use the arrow buttons on the bottom toolbar to navigate between pages or specify the number of the page you want to open.