Class distribution
The class distribution chart shows the amount of samples per class by one of the sources—model or ground truth. This allows detecting the unbalanced class distributions that may cause problems in classification models. The class distribution chart for other sources is available in the label and training centers.
Note
The chart takes into account the filters you have applied. However, if you apply a filter when the chart is already open, the filter isn't considered. To refresh the chart, click Clear in the upper-right corner of the Chart setup panel, and then set up the chart again.
To view the class distribution chart
- If the charts section is hidden, on the top toolbar, click the charts button (
 ).
). - On the right, in the Charts setup panel, select Class distribution.
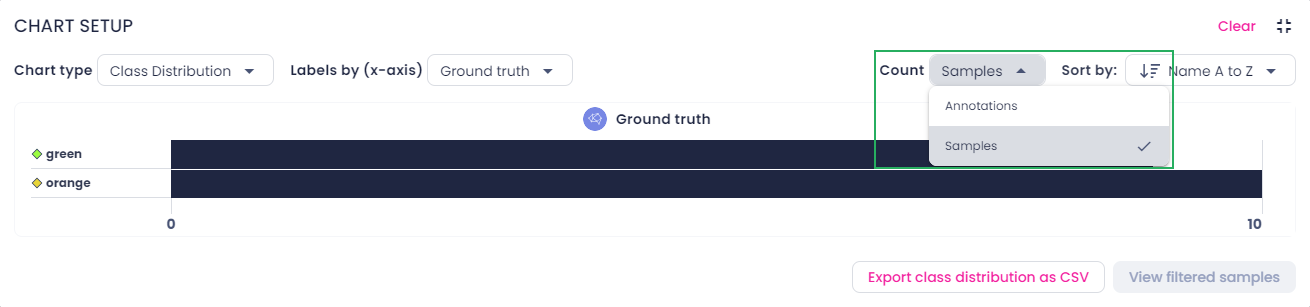
- In Labels by, select the source of labels to display in the chart.
-
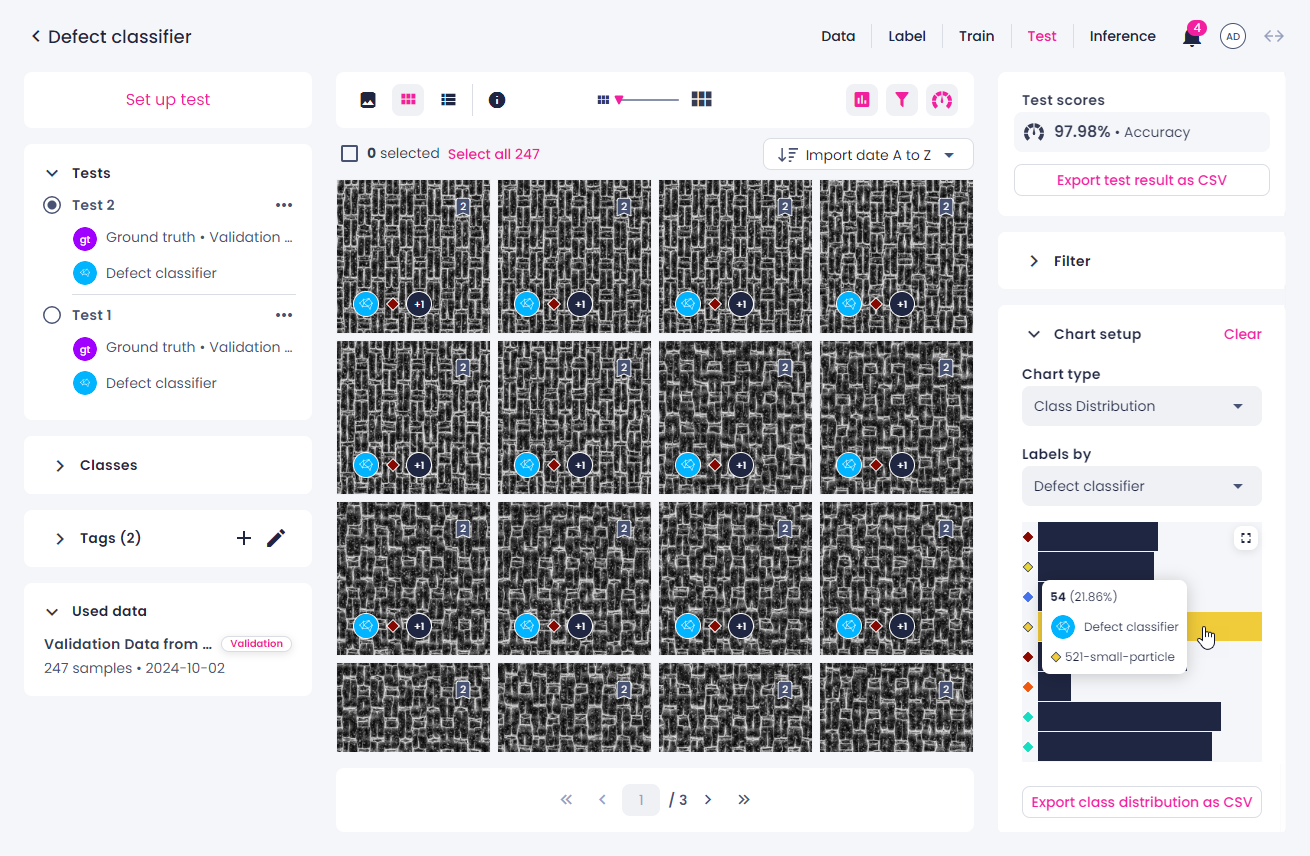
To view the number and percentage of samples labeled with a certain class, hover over the respective bar.
-
To filter the samples by class, click the bar next to the necessary class. To display all the samples, click the same bar again.
- To maximize the chart to full screen, in the upper-right corner of the chart, click
 .
. -
Object detection, instance and semantic segmentation: Select what the chart needs to display: annotations or samples.
-
To minimize the chart, in the upper-right corner, click
 .
. - To export the chart as a CSV table, click Export class distribution as CSV.
- To clear the chart setup, in the upper-right corner, click Clear.