Confusion matrix
![]() Supported for: EfficientNet, AI-ADC EfficientNet, YOLOv8+ object detection and instance segmentation
Supported for: EfficientNet, AI-ADC EfficientNet, YOLOv8+ object detection and instance segmentation
Using the confusion matrix in the test center, you can compare a model against the ground truth or another model. The confusion matrix makes it easy to tell how accurately a model categorizes each annotation and where it might be making errors.
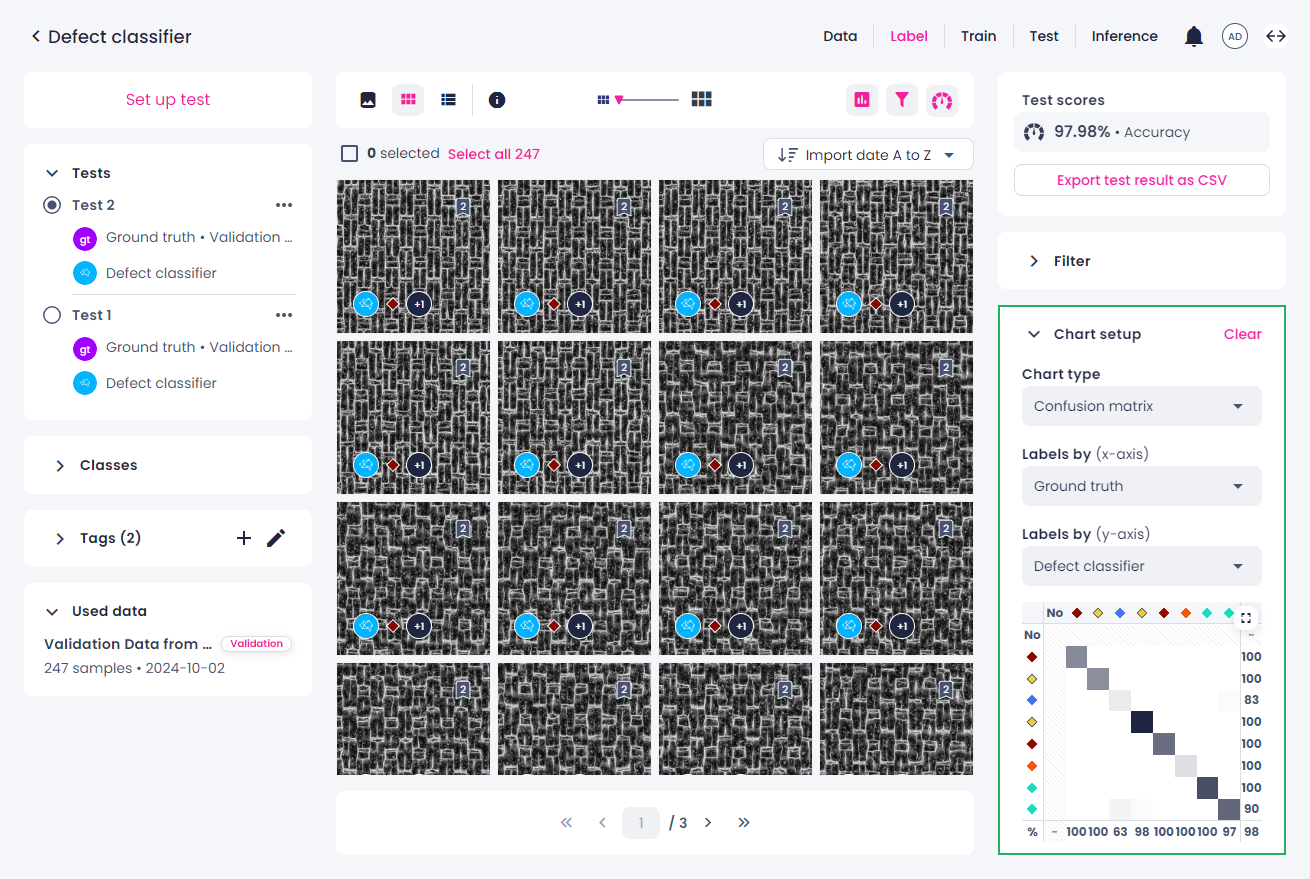
Once a test is done, the confusion matrix is displayed in the right panel of the test center. You can use the confusion matrix in full-screen mode, minimized, or side-by-side with the samples:
- To maximize the chart to full screen, in the upper-right corner of the chart, click
 .
. - To minimize the chart, in the upper-right corner, click
 .
. - To view the chart side-by-side with the samples, change the platform layout to the split-view mode.
When using the chart, note the following: if you apply any filters in the Filters panel, and then open the confusion matrix, it won't consider them. The number and percentage of samples (image classification) or annotation pairs (object detection and instance segmentation) that are labeled with a certain class will be incorrect.
Confusion matrix for labels
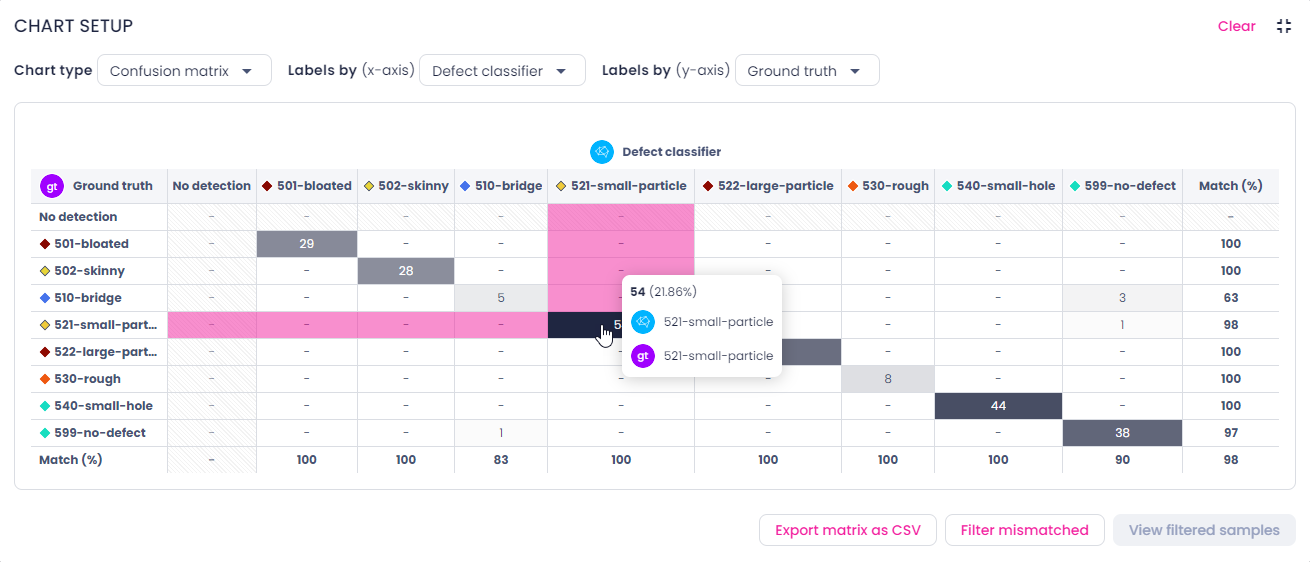
Image classification involves assigning a class to an entire image, with labels used as the annotation type. In the confusion matrix, the diagonal elements show the number of samples for which the predicted label is equal to the true label, while off-diagonal elements are those that are mislabeled by the classifier. Therefore, the higher the diagonal values of the confusion matrix, the better—indicating many correct predictions.
To view the number and percentage of samples labeled with a certain class, hover over the respective cell.
You can filter samples categorized by the confusion matrix. For this, do one of the following:
- To view the samples per one category, click the necessary table cell. To go back to all the samples, click the same cell again.
-
To select multiple cells of the matrix, hold the Ctrl/Cmd key, and then select the necessary cells. This shortcut is only available when the matrix is minimized.
-
To view all mismatched (off-diagonal) samples, click the Filter mismatched button below the matrix. To clear the selection, click Deselect mismatched.
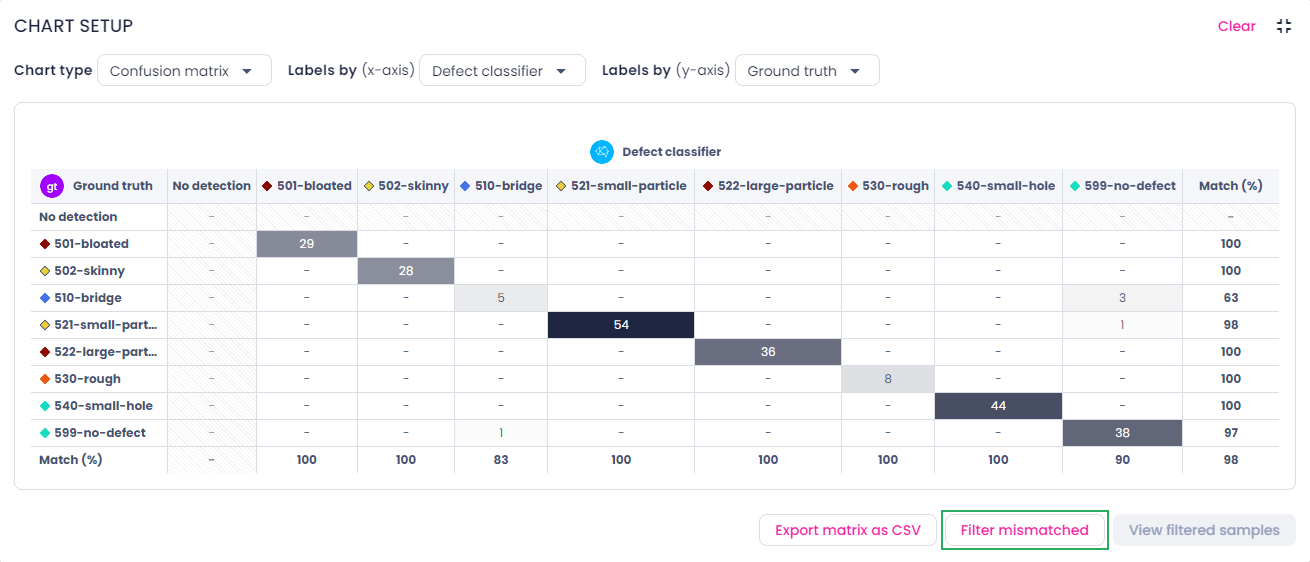
To export the chart as a CSV table, click Export matrix as CSV.
To clear the chart setup, in the upper-right corner, click Clear.
Confusion matrix for bounding boxes and masks
In object detection projects, annotations are represented by bounding boxes, while in instance segmentation – by masks. The confusion matrix helps visualize model performance: diagonal elements show the number of annotation pairs (two bounding boxes or two masks) where predicted annotations match the true ones, while off-diagonal elements highlight misclassifications. A higher concentration of values along the diagonal indicates better performance, as it reflects more correct predictions.
When multiple detections overlap with the same ground truth, only the highest IoU match is selected.
The confusion matrix also tracks unpaired annotations, such as predicted annotations with no matching ground truth or ground truth annotations with no matching prediction.
By default, the confusion matrix is generated based on the confidence score that was set during the test setup. You can move the slider to view confusion matrices at higher confidence thresholds (up to 0.9).
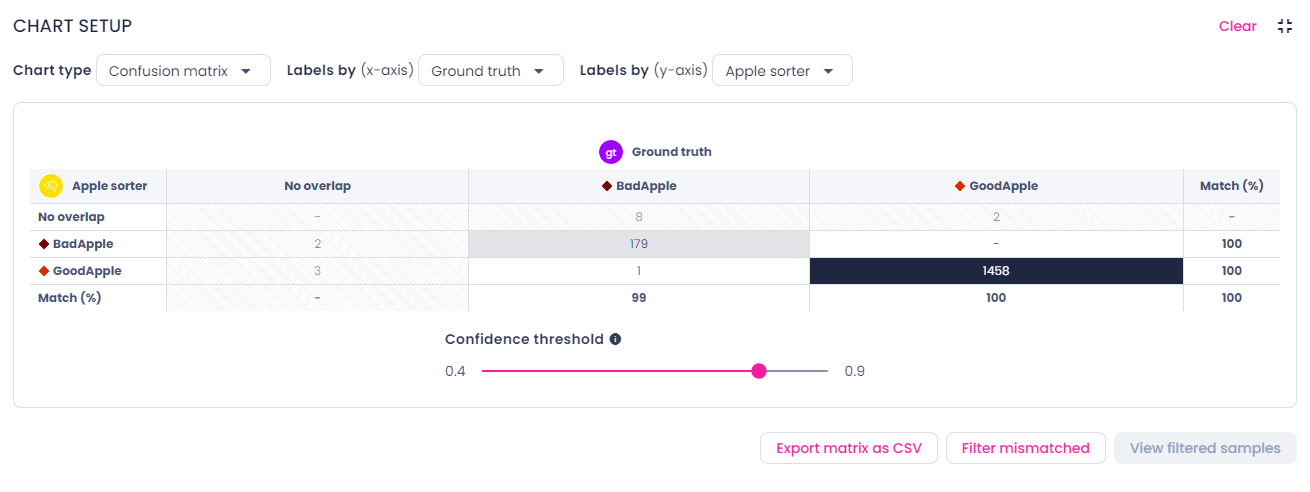
To view the number and percentage of annotation pairs (two bounding boxes or two masks) labeled with a certain class, hover over the respective cell.
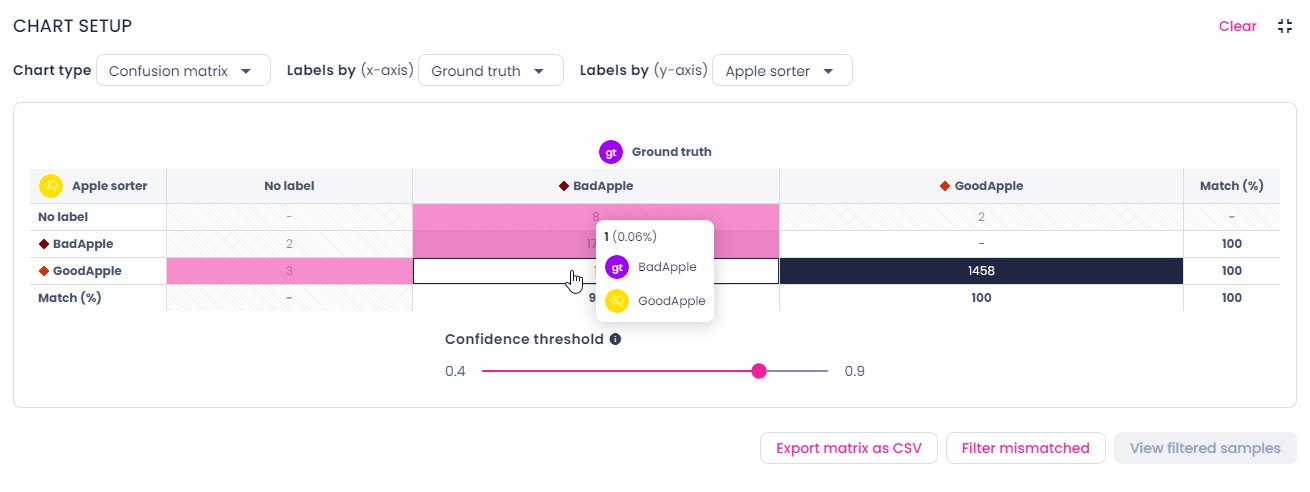
You can filter annotations categorized by the confusion matrix. For this, do one of the following:
- To view the annotations per one category, click the necessary table cell. To go back to all the samples, click the same cell again.
- To select multiple cells of the matrix, hold the Ctrl/Cmd key, and then select the necessary cells. This shortcut is only available when the matrix is minimized.
- To view all mismatched (off-diagonal) annotations, click the Filter mismatched button below the matrix. To clear the selection, click Deselect mismatched.
To export the chart as a CSV table, click Export matrix as CSV.
To clear the chart setup, in the upper-right corner, click Clear.