
Label data
To support classification projects, Robovision AI allows adding a classification label to an image or a batch of images.
To label with a classification label
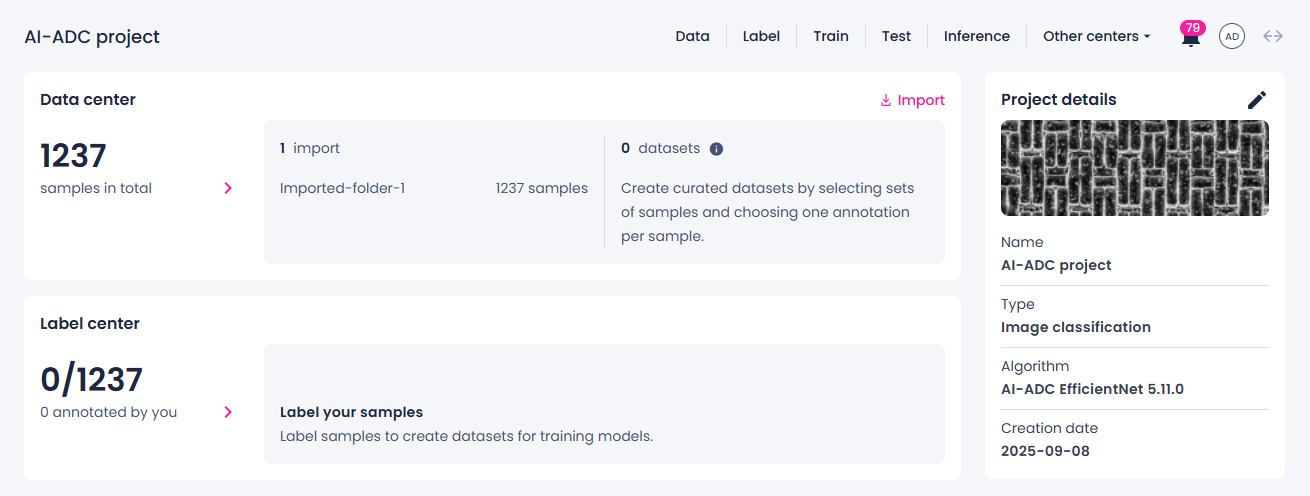
- In the Projects module, click the necessary project.
-
In the Label center section, select the needed import or click the right-arrow button (
 ).
).
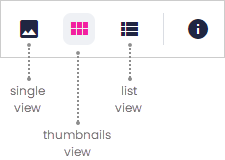
The data opens in the label center. You can label images in one of the views—single, thumbnails, or list. To switch the view, click the corresponding button.
-
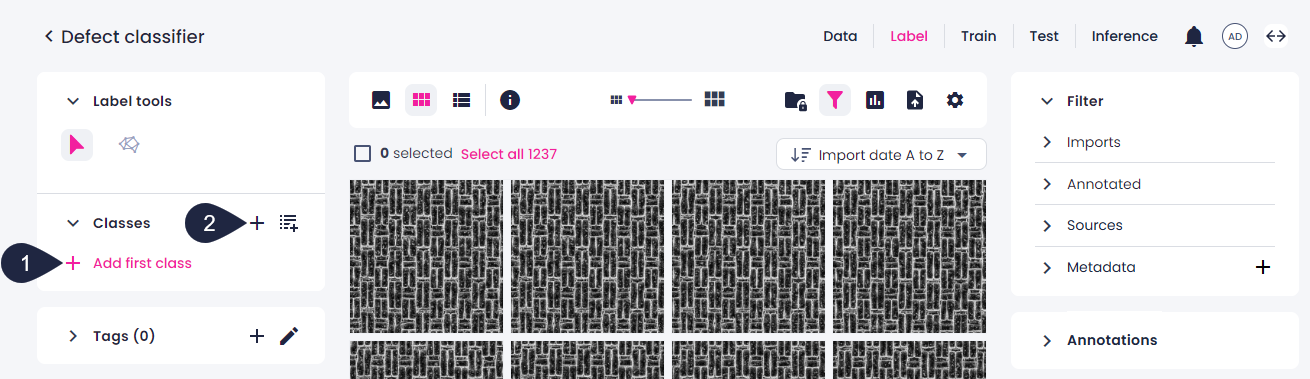
To add a new class:
-
In the left panel, in the Classes section, click Add first class (1) or the plus button (2).
-
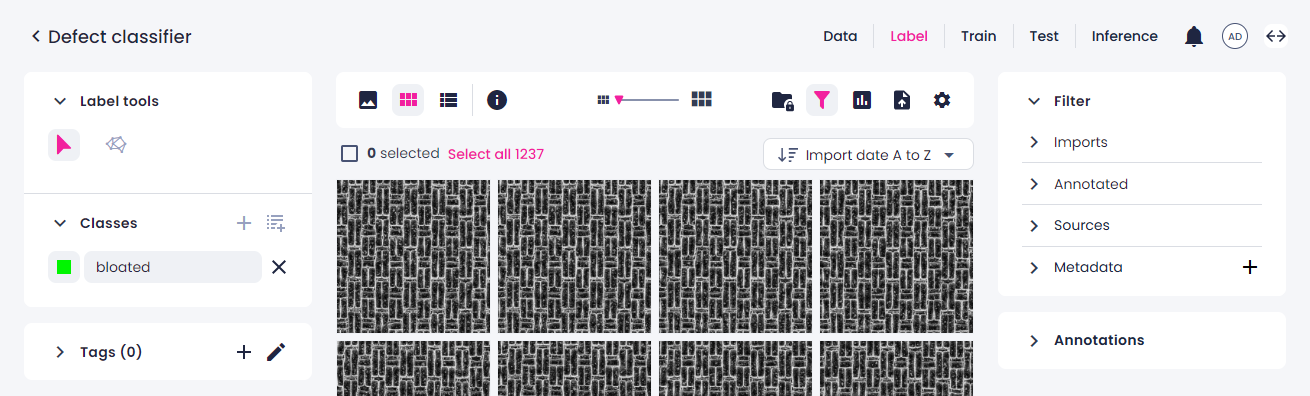
Enter the class name and press Enter.
-
-
For labeling in the thumbnails or list view, select the samples belonging to the same class:
- In the thumbnails view, you can select multiple samples by dragging over them. Alternatively, you can hold the Ctrl/Cmd key and select the necessary samples.
- In the list view, select the checkboxes next to the necessary samples.
You can also hold the Shift key and select the first and last samples.
Note
If you select samples and then go to another page, these samples will no longer be selected.
-
In the left panel, in the Classes section, select the necessary class.
- Click Submit to save the label, and go to the next sample.
To navigate between samples, use one of the following:
- In the single view, use the arrow buttons on the bottom toolbar to navigate between samples or specify the number of the sample you want to open.
-
In the thumbnails and list views, you can view a maximum of 100 samples per page:
- Use the Status panel on the left to navigate between the 100 samples on the page. You can also get the overview of the labeled and unlabeled samples within the page. The labeled samples are marked with green or blue, while unlabeled – with gray. Green indicates that the sample is annotated by the logged-in user, while blue indicates that the annotation comes from another user or is generated by the Prediction tool.
- Use the arrow buttons on the bottom toolbar to navigate between pages or specify the number of the page you want to open.